


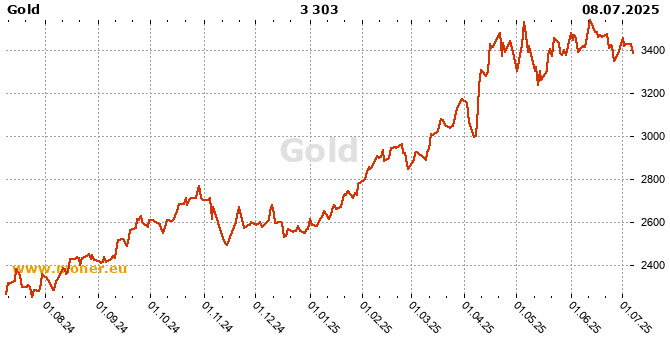
Gold, Commodities history
Gold history chart, last update July 8, 2025
Gold onlineLoading....
Last 15 days history
| Date | Middle |
| July 8, 2025 | 3303.595000 |
| July 7, 2025 | 3336.615000 |
| July 4, 2025 | 3337.225000 |
| July 3, 2025 | 3328.082500 |
| July 2, 2025 | 3359.727500 |
| July 1, 2025 | 3337.815000 |
| June 30, 2025 | 3307.297500 |
| June 27, 2025 | 3271.905000 |
| June 26, 2025 | 3331.275000 |
| June 25, 2025 | 3334.912500 |
| June 24, 2025 | 3324.095000 |
| June 23, 2025 | 3375.750000 |
| June 20, 2025 | 3365.435000 |
| June 19, 2025 | 3370.680000 |
| June 18, 2025 | 3366.072500 |
Gold history chart
Time: July 9, 2025, 4:55 p.m.
| London time: | July 9, 2025, 4:55 p.m. |
| NY time: | July 9, 2025, 11:55 a.m. |
| Tokyo time: | July 10, 2025, 12:55 a.m. |