


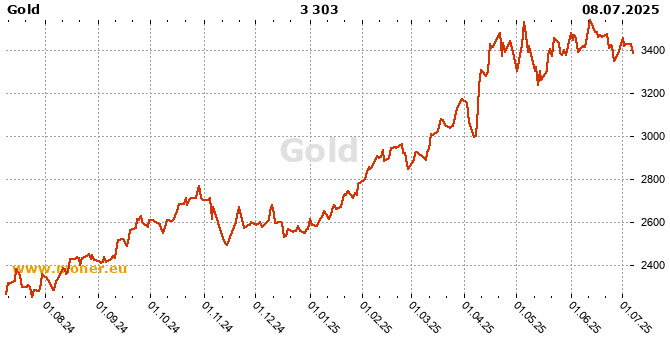
Gold, Commodities history
Gold history chart, last update June 22, 2026
Gold onlineLoading....
Last 15 days history
| Date | Middle |
| June 22, 2026 | 4189.953300 |
| June 19, 2026 | 4156.020000 |
| June 18, 2026 | 4216.055000 |
| June 17, 2026 | 4246.356700 |
| June 16, 2026 | 4333.765000 |
| June 15, 2026 | 4318.301300 |
| June 12, 2026 | 4209.075000 |
| June 11, 2026 | 4212.633300 |
| June 10, 2026 | 4078.371300 |
| June 9, 2026 | 4258.137500 |
| June 8, 2026 | 4328.391300 |
| June 5, 2026 | 4315.811700 |
| June 4, 2026 | 4478.456700 |
| June 3, 2026 | 4441.873800 |
| June 2, 2026 | 4487.995000 |
Gold history chart
Time: June 23, 2026, 8:52 p.m.
| London time: | June 23, 2026, 8:52 p.m. |
| NY time: | June 23, 2026, 3:52 p.m. |
| Tokyo time: | June 24, 2026, 4:52 a.m. |