


Natural Gas, Commodities history
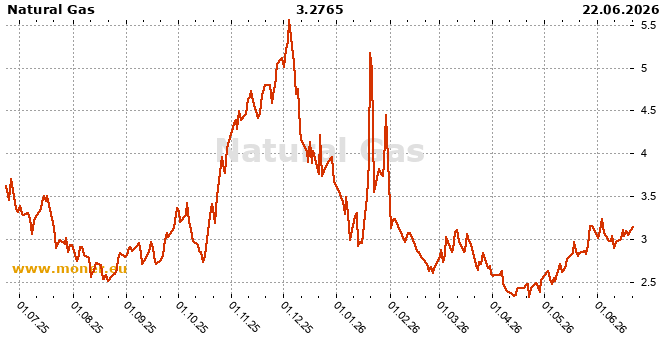
Natural Gas history chart, last update June 22, 2026
Natural Gas onlineLoading....
Last 15 days history
| Date | Middle |
| June 22, 2026 | 3.276500 |
| June 19, 2026 | 3.199500 |
| June 18, 2026 | 3.231500 |
| June 17, 2026 | 3.181500 |
| June 16, 2026 | 3.246500 |
| June 15, 2026 | 3.158500 |
| June 12, 2026 | 3.129500 |
| June 11, 2026 | 3.072500 |
| June 10, 2026 | 3.182500 |
| June 9, 2026 | 3.137500 |
| June 8, 2026 | 3.137500 |
| June 5, 2026 | 3.219500 |
| June 4, 2026 | 3.350500 |
| June 3, 2026 | 3.231500 |
| June 2, 2026 | 3.165500 |
Natural Gas history chart
Time: June 23, 2026, 8:57 p.m.
| London time: | June 23, 2026, 8:57 p.m. |
| NY time: | June 23, 2026, 3:57 p.m. |
| Tokyo time: | June 24, 2026, 4:57 a.m. |